Application of Nano Edible Films to Improve Some Dates in Saudi Arabia
Eman A. Abdel Khafar1, 2, Zahra El -Duma Abdullah 2, 3, Hosam El Din Aboul-Anean1*
1 Food Engineering & Packaging Dept., Food Technology Research Institute, Agricultural Research Center, Giza, Egypt.
2 Department of Nutrition and Science, Faculty of Home Economics, University of Tabuk, Saudi Arabia.
3 Home Economics Dept., Faculty of Specific Education, University of Tabuk, Saudi Arabia.
*Email: hosam.ftri @ yahoo.com
ABSTRACT
Nano edible films represent advanced technology in food processing to improve the quality of food products. In different materials were used such as (A) Carrageenan/kafirin nanoparticles/beeswax/oleic acid, (B) pectin/Tripolyphosphate (TPP)/bees wax, (C) Calcium alginate/CaCO3/glucono-d-lactone (GDL), (D) Guar gum/titanium dioxide (TiO2)/candela wax/linolenic acid, (E) Carboxymethyl cellulose/polyvinyl alcohol (PVA)/Tannin, and (F) Gguar-xanthan/Lemongrass oil/cellulose–acetate nanoparticles to evaluate the impact of edible films on quality attributes in Medjool and Barhy products during storage at (0 °C) and relative humidity of 70-75%. The results indicated that decreasing the percentage of weight loss leads to excellent appearance until 60 days of cold storage in treatments coated with nanomaterials besides lower total microbial counts. The physical, chemical and mechanical analyses were determined and the results indicated that the best samples were natural films with nanosuspension (B) followed by the samples (C, E, A, D, and F).
Key words: Edible films, Medjool and Barhy products, nanomaterials.
INTRODUCTION
Medjool and Barhy products have wonderful nutritional, medical and economic value, they represent the most significant crops in arid and semiarid areas of the Arabian Peninsula, the Middle East, and North Africa. The cumulative world date production was estimated to be 7,548,918 metric tonnes that Egypt alone produces 1,470,000 mt of date fruit annually being classified as the first country among the top five world producers [1]. “Gum” is a class of naturally occurring polysaccharides that can form gels or viscous solutions with water or stabilize the emulsion system [2]. Polysaccharides are also known as hydrocolloids, which act as nutrients and dietary fiber sources [3, 4]. Gum is rich in fiber, edible, and has been classified by the FDA in the United States as a safe dietary fiber [5]. Due to these properties, gums have many industrial applications [6]. Among the most fully recognized and applied industry are gums, methylcellulose and carboxymethylcellulose aimed at improving the quality and safety of bread and dough [7]. Xanthan gum is an extracellular polysaccharide obtained by air fermentation, the influence of which has been proven on swelling, solubility, and viscosity of whey and starch. Also, gum improves the stability and viscosity of starch gel depending on mechanical properties. Alginate and gelane have also the ability to form insoluble polymers or strong gels and colloidal properties such as the reaction with mineral cations such as calcium [8]. These gums and alginates are marine algae with a linear polymer of 1.4 crosslinked D-mannuronic acid and α-L-guluronic which is a tetrasaccharide with a unit of β-D-glucuronic and α-L-rhamnose in a ratio of 2: 1: 1 obtained from the bacteria Sphingomonas elodea [9]. Numerous natural polysaccharides and proteins receive significant attention for edible food coverage films that respond to customer demand for safe and healthy foods free of artificial agents [10]. Being fully degradable as environmentally friendly cases, shake films rely on natural sugars and proteins and are used as a substitute for synthetic packaging. The rheological properties can help the flow of the pumpable fluids depending on the flow behavior index and consistency index and therefore play a major role in the solution pathology and the coefficient of strength. The rheological properties affect the viscosity of nano starch molecules and their ability to influence the delivery of the active components and the performance films and improving the properties of viscosity solutions [11]. Starch hydrolysis process by hydrochloric acid at room temperatures through preferential attack of acid molecules occurs in the sharp peak crystals and amorphous regions of the granules to utilize the special size of molecules on a large scale as biologically active nanoparticles that can be applied in agricultural, medical, biological, and technological fields [12]. The shaking of nanoemulsions is whether colloidal consisting of oil and aqueous phase and every drop of oil surround water and could form a thin layer of emulsion particles with a size range from 50 to 500 nm. Wherever two types of nanoemulsions are available, depending on the stages, oil/water, nanoemulsions are dynamically unstable [13].
The objectives of this study were to study the effect of nanoparticles edible films on the quality attribute of some varieties of Medjool and Barhy products in various treatments to prolong shelf life, and also to determine the mathematical model for the moisture of Medjool and Barhy products during storage.
MATERIALS AND METHODS:
Materials:
The present study was conducted through growing seasons of 2018 aimed at comparing two Arabian date palm cultivars namely "Medjool" and "Barhy" that the latter is grown in a private orchard located in 63 kilometers from Elwadi El-Faregh (REGWA CO.), Cairo/Alexandria desert road, Giza governorate, Egypt. The effect of nanotechnology in edible films on the quality of Medjool and Barhy products was studied at the Central Lab of Agriculture Res, Giza, Egypt. The substances used in this experiment were Gguar, Xanthan, Carrageenan, Calendula wax, Carboxymethyl cellulose and (CaCO3) which was obtained from Acros-Organics Company, New Jersey, USA. Cellulose-acetate, Calcium Hypochlorite, and Sorbitol were obtained from Company, LTD, China. Lemongrass oil, starch, Calcium Alginate, Guar gum, glucono-d-lactone (GDL), Kafirin, Titanium dioxide (TiO2), Tripolyphosphate (TPP) and poly (vinyl alcohol) PVA/Tannin compound were obtained from Acmatic for Chemicals & Lab Equipment Company, Cairo, Egypt.
Preparation of different treatments:
Medjool and Barhy dates were stored overnight at 0 ºC and 70-75% RH. The next day, the fruits were washed with water and immersed for 1 min in a disinfectant solution of calcium hypochlorite (0.25 g/L distilled water) and then dried by air. The fruits were divided into six treatments as follows:
- Carrageenan/kafirin nanoparticles film-forming solution
In addition to melting the required beeswax and oleic acid, the hot solution was emulsified with a homogenizer.
- Rehydrating pectin/Tripolyphosphate (TPP) nanoparticles plus melted beeswax were added and emulsified using a homogenizer [14].
- Calcium alginate plus an amount of CaCO3 (0.03 g / g alginate) with glucono-d-lactone (GDL) was added.
- Guar gum/titanium dioxide (TiO2) nanoparticles in addition to melting the required candela wax and linolenic acid were added [15].
- Carboxymethyl cellulose plus poly (vinyl alcohol) PVA /Tannin compound nanoparticles were prepared by solution casting in the form of thin films [16].
- Gguar-xanthan plus lemongrass nano-emulsion oil with water incorporated into cellulose-acetate nanoparticles [13].
The dipping period for each treatment was one minute then Medjool and Barhy dates were dried after dipping and packaged in plastic trays with approximately 1Kg weight. Each treatment contained 8 trays, and each tray was considered as one replicate. Each treatment (8 trays) was packed in one carton box. After that, all boxes were stored at 0°C and 70-75% RH for 60 days and kept in carton boxes. The cooled storage was carried out in the post-harvest research department, Horticulture research institute, Agriculture research center-Giza.
Physical, mechanical and rheological properties of the prepared nanotechnology on edible films:
- Rheological measurements: The rheological properties of edible natural film solutions were measured using Brookfield Engineering Laboratories DV-III Rheometer at the selected temperature. The viscometer was operated between 10 and 60 rpm.
- Zetasizer nano: Company: Malvern, UK; Type: Zetasizer nano series (Nano ZS); Size range (nm): 0.6: 6000 nm; Zeta potential range (mV): (-200: 200mV); and the model: XPERT-PRO-PANalytical-Netherland
- Measurement of the prepared edible films using scanning electron microscopy
INSPECT S- SEM schematic overview – TM 1999-2007 Bwilddate, FEL company Euld number D 8571 Machine type inspect S. - Film thickness: The film thickness was measured using a digital micrometer (Mitutoyo company for digimatic indicator, model: pk-1012 E, Japan).
- % Solubility in water: The samples of different nanoparticles (A, B, C, D, E, and F) were dried in drying containing dry calcium chloride. A sample of 500 mg dry films was immersed in cups containing 50 ml of distilled water at room temperature within 24 hours with a gentle periodic shaker incubator. The dry film has been reported as follows: Weight loss% = Initial dry weight - Final dry weight x 100 / Initial dry weight.
- Mechanical properties of the prepared nanotechnology on edible films:
The tensile properties (Tensile strength, and elongation) were measured by a texture analyzer CT3. The film's nanoparticles at different treatments (A, B, C, D, E, and F) were cut into strips 3 x 5cm.
- Determination of Water vapor permeability (WVP):
The water vapor permeability is determined using the following:
WVPR=∆m/AWtAWVP=WVPR.L/∆RH
Where ∆m / ∆t is the moisture gain weight per time (g/s), A is the surface area of the film m2, L is the film thickness (mm) and ∆RH is the difference in relative humidity (ASTM E96–95).
- Measurement of gas Permeability
Gas analyzer (O2 / CO2) was used following the method described by García et al. (2000) [17]. The gas permeability (P) was calculated according to the following equation: P=Q.X /A.t.∆p
Physical and chemical properties:
- Chemical analysis:
Weight loss, total soluble solids (TSS%), acidity, total sugars and reducing sugars were determined according to the methods of AOAC (2010) [18]. Total carbohydrate was determined by the phenol sulfuric acid method as described by Dubois et al. (1956) [19]. Total phenols content was extracted using the method of Kahkonen et al. (1999) and determined by using the method of Ivanova et al. (2010) [20, 21] while fractionation and identification of phenolic compounds and flavonoids were determined by HPLC according to the method of Goupy et al. (1999) [22]. The internal color and values of Medjool and Barhy dates were measured by using Minolta Chroma Meter, Model CR – 200. Calibration was done by a white plate before use. Color changes were quantified for L value which refers to the lightness, and a value which refers to yellow tonality [23].
- Microbial analysis:
The total microbiological count was determined according to Marshall (1992) [24]. All the microbiological counts were carried out in duplicates Molds and yeasts counts were determined using the methods for the microbiological examination of foods described by A.P.H.A (1976) [25].
- Statistical Analysis:
The mean values were compared using the LSD method at a 5% level according to a completely randomized design [26].
RESULTS AND DISCUSSION
Rheological properties of the prepared nanomaterial of edible films
The rheological property (shear stress) of the samples (A, B, C, D, E, and F) was measured at (9.30, 18.60, 27.90, 37.20, 46.50, 55.801/s). Table (1) and Figure (1) shows the relationship among shear rate, and shear stress in different treatments. The results showed that the samples exhibited non-Newtonian pseudoplastic behavior and fit the power low equation τ = kγn → (1) where: τ: shear stress, pa γ: shear rate 1 / sec, k: consistency index, and n: flow behavior index. As the shear rate increased, the shear stress increases at different treatments (A, B, C, D, E, and F). The result showed that k was decreased with different treatments and (n) did not give a trend as previously discussed by Suisui et al. (2016), Ottone et al. (2005) [27], and Walkenstrom et al. (1999) [28].
Table 1: The relation between consistency index (k) and flow behavior index (n) at different (a,b,c,d, e, and f) nanomaterials of edible films
|
Treatments |
shear stress |
||
|
k |
n |
R2 |
|
|
A |
0.01268 |
0.6834 |
0.9961 |
|
B |
0.0672 |
0.6661 |
0.9877 |
|
C |
0.0281 |
0.0767 |
0.9945 |
|
D |
0.120 |
0.7241 |
0.9586 |
|
E |
0.4566 |
0.4494 |
0.9724 |
|
F |
0.293 |
0.4953 |
0.9287 |
Figure 1. The relation between shear rate and shear stress in different treatments
Physical and mechanical properties of different nano on edible films
The results in Table (2) showed that the thickness of edible films B 65, D 70 and F 7 was lower than E 80, C87 and A91. From the results, it can be observed that the lowest value of tensile strength (B34.21, D38.43, F39.43,C40.34 and A45.23N.M.M2), elongation (B11.34, D12.54, C13.45, E14.78, A15.22 and F15.44%), (Oxygen F15.63, E16.45, B17.44, D18.27, C19.20 and A2034 M3.M / M2 X10-7), (CO2 C23. 22 , D24.55, B25.34, F27.21, 28.45 and 29.30 M3.M / M2 X10-8 ), water vapors permeability (3.67 and 2.86 g / m2.24hr) and solubility (9.16 and 14.22%) was recorded for the treatments B and E. Also, A and D treatments showed higher tensile strength (24.26 and 50.00 NMM2), elongation (12.11 and 16.78%), (Oxygen 25.32 and 19.87 M3.M / M2 X10-7), (CO2 26.89 and 24.56 M3.M / M2 X10-8), Water vapors permeability (E5.45, F6.47, B7.78, D8.00, 8.98 and A9.32 g / m2.24hr) and solubility (E25.50, F26.88, 27.23, B34.65, C39.20 and A45.67%). Similar results were reported by Danijela Z. Šuput1 et al. (2016) and Franciele et al. (2013) [29, 30]. All major factors significantly affected the film's mechanics as follows: Chitosan film had an 18% higher elongation than the Chitosan / Quinoa Protein Film as well as a fusion of nanoparticles with thymol, which reduced the chitosan film.
Table 2. Thickness, mechanical properties and permeability of different edible films
|
Treatments |
Thickness µm |
Mechanical |
Permeability |
% Solubility in water |
|||
|
Tensile strength (N/M2) |
Elongation (%) |
O2 M3.M/M2×10-7day.mmHg |
CO2 M3.M/M2 ×10-8 day.mmHg |
Water vapors [g/m2.24hr] |
|||
|
A |
91 |
45.23 |
15.22 |
20.34 |
28.45 |
9.32 |
45.67 |
|
B |
65 |
34.21 |
11.34 |
17.44 |
25.34 |
7.78 |
34.56 |
|
C |
87 |
40.34 |
13.45 |
19.20 |
23.22 |
8.98 |
39.20 |
|
D |
70 |
38.43 |
12.54 |
18.27 |
24.55 |
8.00 |
27.23 |
|
E |
80 |
42.10 |
14.78 |
16.45 |
29.30 |
5.45 |
25.50 |
|
F |
77 |
39.43 |
15.44 |
15.63 |
27.21 |
6.47 |
26.88 |
Determination of particle size distribution and Zeta potential produced films solution
Particle size distribution
Table (3) and Figure (2) demonstrated that the solution was evaluated based on the change in volume (average) and the z potential of nanoparticles for edible film, the poly dispersion index (PDI) were at the peak 1,000, 1,000, 0.794, 0.964, 1,000 and 1,000, for the treatments b, c, d, e, and f respectively. The hydrodynamic diameter of the partial volume at peaks 1 and 2 was 720.6-110, 504.7, 594.2, 870.8-163.5, 712-125 and 880.2-142.1nm for the treatments A, B, C, D, E, and F respectively. The increase in particle size may be due to some parameters due to the high viscosity of gum solutions as in Table 3. It is similar to the results obtained by Jie Xiao et al., (2016) [31]. It found that impurities containing starch crystals ranged from 310, 384 to 417 nm.
Table 3. The measured particles size and zeta potential of edible films
|
Treatments |
particle size distribution(nm) |
Zeta potential(mv) |
|||
|
poly dispersity index (PdI) |
hydrodynamic diameter (nm) |
z- potential |
z- deviation |
||
|
a b c d e f |
1.000 1.000 0.794 0.964 1.000 1.000 |
720.6 504.7 594.2 870.8 712.0 880.2 |
110.4 - - 163.5 125 142.1 |
28.9 25. 0 28.0 34.5 27.5 26.4 |
4.82 4.04 0.61 5.96 8.88 4.85 |
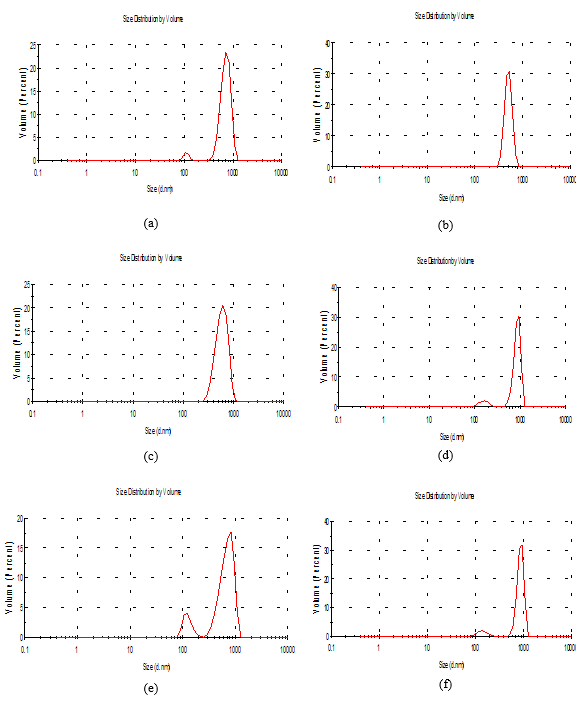
Figure 2. The particle size of the nanomaterials of the edible solutions
Zeta potential
Table (3) and Figure (3), showed that Zeta potential and Zeta Deviation were measured in order to determine the stability of nanoparticles. The results showed that sample A Zeta potential distribution has (mV): 28.9 and Zeta Deviation (mV): 4.82. However, we found that the characterization of the one peak of zeta potential distribution and Zeta Deviation in the area below the curve was 100%. It was found that the content of Zeta potential in the peak of different treatments B, C, D, E, and F had zeta potential of 25.0, 28.0, 34.5, 27.5 and 26.4 (mV) respectively. The content of zeta deviation in the peak of different treatments B, C, D, E, and F had zeta deviation 4.04, 0.61, 5.96, 8.88 and 4.85 respectively. Zeta potential determines the electrostatic repulsion among them and is accountable for their stability against precipitation [32, 33]. A desirable zeta potential could be obtained by Zi Teng (2015) [34].
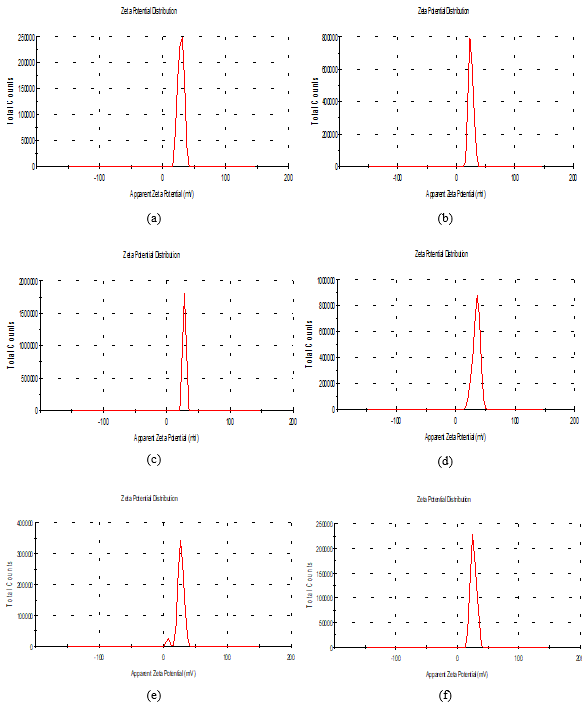
Figure 3. Zeta potential of the solution
The microstructure of the edible films nanoparticles using scanning electron microscopy (SEM) technique
The microscopic images of six edible film nanoparticles are presented in Figure (A, B, C, D, E, and F). Also, the films have a homogeneous structure with some micro granules embedded in a continuous matrix. The characteristics of nanoparticles edible films are shown in Figure (4). When a section was taken to characterize the nanosphere, the image was (B504nm) followed by (C594nm), (E712nm), (A720nm), (D 870nm) and (F was 880nm) [35]. The preparation of spherical particles of uniform size (~ 200nm) has been found to be rather narrow, with several other kinds of polydisperse aggregates and anisotropic structures being formed above or below the optimum pH (~6).
The particle size has a wide range of shapes and size according to Patricia et al. (2010) and Franciele et al. (2013) [30].
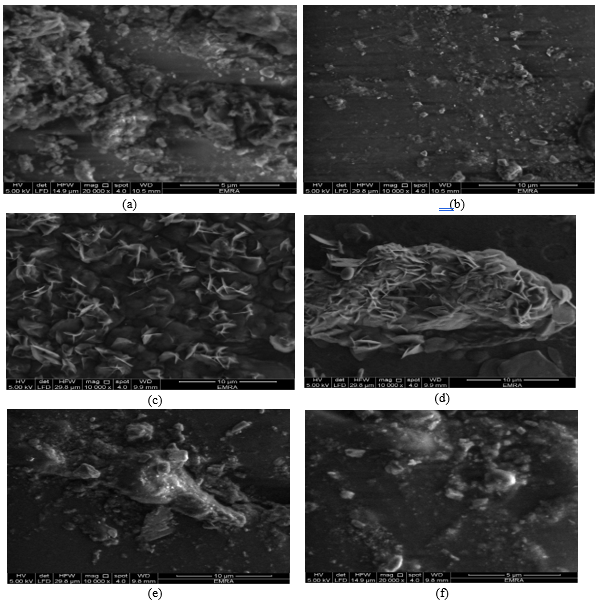
Figure 4: (a, b, c, d, e, and f): SEM micrograph of the produced Films
Physico-chemical and microbiological of coated Medjool and Barhy dates during the storage period
Weight loss percentage
The results obtained are presented in Table (4). It could be observed that the weight loss increased with increasing the storage period in both samples kept in packaged plastic trays and with carton boxes. The Barhy treatment indicates higher weight loss than the Medjool. The results indicated that the highest percentage of loss in the date palm Medjool during storage was eight weeks in treatment F, followed by treatment A and D, while the lowest percentage was treated with E, followed by B and C. On the other hand, it was found that the percentage of loss in Barhy during the storage on the same period of 8 weeks in treatment A followed by treatment B and then treatment C while the lowest percentage was E followed by treatment F and D. Edible coating reduced the weight loss because it has semi-permeable properties which lead to extend shelf life by reducing moisture reported by Bellaouchi R (2017) and Rojas-Grau et al. (2008) [8, 36]. Moreover, decreasing the weight loss and increasing the fruit storability were observed [37, 38].
Table 4. The effect of edible coating on weight loss in Medjool and Barhy
|
Storage period (week) |
Medjool |
Barhy |
||||||||||
|
A |
B |
C |
D |
E |
F |
A |
B |
C |
D |
E |
F |
|
|
0 |
0.00 |
0.00 |
0.00 |
0.00 |
0.00 |
0.00 |
0.00 |
0.00 |
0.00 |
0.00 |
0.00 |
0.00 |
|
1 |
1.80 |
1.60 |
1.56 |
1.34 |
1.75 |
1.36 |
1.95 |
2.12 |
2.40 |
2.96 |
2.67 |
2.90 |
|
2 |
1.98 |
2.0 |
1.87 |
1.56 |
1.86 |
1.85 |
2.10 |
2.45 |
2.87 |
3.69 |
2.78 |
3.56 |
|
3 |
2.30 |
2.40 |
2.25 |
2.10 |
2.21 |
2.35 |
2.45 |
2.80 |
2.90 |
3.96 |
2.96 |
3.78 |
|
4 |
2.70 |
2.75 |
2.67 |
2.45 |
2.50 |
2.80 |
2.68 |
2.95 |
3.40 |
4.24 |
3.10 |
3.90 |
|
5 |
2.96 |
2.90 |
2.96 |
2.68 |
2.60 |
2.96 |
2.95 |
3.45 |
3.65 |
4.70 |
3.45 |
4.30 |
|
6 |
3.56 |
3.20 |
3.34 |
3.30 |
3.12 |
3.45 |
3.69 |
3.89 |
3.97 |
4.85 |
3.68 |
4.47 |
|
7 |
3.80 |
3.45 |
3.67 |
3.20 |
3.23 |
3.57 |
4.0 |
4.0 |
4.20 |
4.97 |
3.87 |
4.80 |
|
8 |
3.95 |
3.55 |
3.85 |
3.45 |
3.43 |
3.90 |
4.34 |
4.23 |
4.54 |
5.23 |
4.0 |
4.99 |
|
L.S.D. |
S = 1.754 |
T = 1.546 |
S&T = 0.218 |
S = 1.674 |
T = 1.564 |
S&T = 0.118 |
||||||
Total soluble solids (TSS)
From the results indicated in Table (5), it could be noticed that the TSS in Medjool and Barhy was gradually increased with increasing the storage period at cooled temperatures in both samples kept in packaged plastic trays and with carton boxes. In general, the TSS in Medjool (A, B, and C) of all treatments was higher than that of (D, E, and F); while, Barhy (A, B, C, and D) of all treatments was higher than that of (E and F). According to Esam A. (2016) [39], Abd El-Zaher MH. (2008) [37], Omaima M. Hafez. (2011) [38] and Omaima M. Hafez (2012) [40], TSS continued to increase.
Table 5. The effect of edible coating on TSS in Medjool and Barhy products
|
Storage period (week) |
Medjool |
Barhy |
||||||||||
|
A |
B |
C |
D |
E |
F |
A |
B |
C |
D |
E |
F |
|
|
0 |
28.23 |
29.00 |
29.78 |
31.50 |
30.70 |
31.54 |
27.45 |
27.56 |
27.57 |
27.56 |
29.45 |
28.12 |
|
1 |
29.67 |
29.56 |
30.40 |
32.11 |
31.21 |
32.56 |
28.00 |
28.59 |
28.12 |
28.00 |
29.78 |
28.45 |
|
2 |
30.78 |
30.43 |
30.80 |
32.20 |
31.45 |
32.90 |
29.45 |
29.54 |
29.45 |
29.28 |
30.11 |
28.90 |
|
3 |
31.60 |
31.54 |
31.88 |
32.78 |
32.00 |
33.15 |
30.11 |
30.00 |
30.11 |
29.55 |
30.65 |
29.28 |
|
4 |
32.00 |
32.45 |
32.00 |
33.23 |
33.12 |
33.55 |
30.46 |
30.90 |
31.17 |
30.10 |
31.20 |
29.80 |
|
5 |
32.32 |
33.66 |
32.34 |
3315 |
33.11 |
34.00 |
30.68 |
31.35 |
31.80 |
30.46 |
31.67 |
30.54 |
|
6 |
33.14 |
34.54 |
33.00 |
34.56 |
33.54 |
34.34 |
31.00 |
31.57 |
32.15 |
31.23 |
32.11 |
31.00 |
|
7 |
34.23 |
35.60 |
33.58 |
34.00 |
34.00 |
35.00 |
32.54 |
32.14 |
32.60 |
32.48 |
32.34 |
31.45 |
|
8 |
35.15 |
36.00 |
34.55 |
35.45 |
34.56 |
36.34 |
32.56 |
32.80 |
32.843 |
32.67 |
33.00 |
32.17 |
|
L.S.D. |
S = 1.546 |
T = 1.453 |
S&T = 0.156 |
S = 1.487 |
T = 1.489 |
S&T = 0.186 |
||||||
Total acidity
The obtained results in Table (6) show that the total acidity gradually decreased with increasing the storage period in both samples kept in packaged plastic trays and with carton boxes of different treatments according to Omaima M. Hafez (2011), Omaima, M. Hafez (2012), and Esam A (2016). However, the decrease of acidity during storage demonstrated fruit senescence. The same authors outlined that coatings may slow the changes in pH, titratable acidity and effectively delaying fruit senescence [36, 37].
Total carbohydrate, total sugar and reducing sugar in Medjool and Barhy products
The obtained results in Table (7) showed that the total carbohydrate and total sugar gradually increased with increasing storage period in both samples kept in packaged plastic trays and with carton boxes. It indicated that cooling temperature encourages the inversion of fruit starch to simple sugars and accordingly increases the sweetness of fruits. The total sugar content of all coated, packed and control fruit and vegetable quality significantly increased and "Medjool" fruits were the highest in reducing sugars content (47.94%) [36, 41]. This decrease might be due to the consumption of reducing sugars through respiration [39].
Table 6. The effect of edible coating on acidity in Medjool and Barhy products
|
Storage period (week) |
Medjool |
Barhy |
||||||||||
|
A |
B |
C |
D |
E |
F |
A |
B |
C |
D |
E |
F |
|
|
0 |
0.24 |
0.23 |
0.23 |
0.24 |
0.23 |
0.24 |
0.13 |
0.14 |
0.13 |
0.14 |
0.13 |
0.13 |
|
1 |
0.23 |
0.22 |
0.22 |
0.23 |
0.22 |
0.23 |
0.12 |
0.13 |
0.13 |
0.13 |
0.13 |
0.12 |
|
2 |
0.22 |
0.22 |
0.22 |
0.23 |
0.22 |
0.23 |
0.12 |
0.12 |
0.12 |
0.13 |
0.12 |
0.12 |
|
3 |
0.22 |
0.21 |
0.21 |
0.22 |
0.21 |
0.22 |
0.11 |
0.12 |
0.12 |
0.12 |
0.12 |
0.11 |
|
4 |
0.21 |
0.21 |
0.21 |
0.22 |
0.21 |
0.22 |
0.11 |
0.11 |
0.11 |
0.12 |
0.11 |
0.11 |
|
5 |
0.20 |
0.20 |
0.20 |
0.21 |
0.20 |
0.21 |
0.10 |
0.11 |
0.11 |
0.11 |
0.10 |
0.10 |
|
6 |
0.20 |
0.20 |
0.20 |
0.21 |
0.20 |
0.21 |
0.10 |
0.10 |
0.10 |
0.11 |
0.10 |
0.10 |
|
7 |
0.19 |
0.20 |
0.19 |
0.20 |
0.19 |
0.20 |
0.10 |
0.10 |
0.10 |
0.10 |
0.09 |
0.09 |
|
8 |
0.20 |
0.19 |
0.19 |
0.19 |
0.19 |
0.20 |
0.09 |
0.10 |
0.09 |
0.10 |
0.09 |
0.09 |
|
L.S.D. |
S = 1.521 |
T = 1.423 |
S&T = 0.165 |
S = 1.532 |
T = 1.465 |
S&T = 0.187 |
||||||
Table 7. The effect of edible coating on total carbohydrate, total sugar and reducing sugar in Medjool and Barhy products
|
Storage period (week) |
Total carbohydrate |
|||||||||||||
|
Medjool |
Barhy |
|||||||||||||
|
A |
B |
C |
D |
E |
F |
A |
B |
C |
D |
E |
F |
|||
|
0 1 2 3 4 5 6 7 8 |
10.15 11.40 12.11 12.45 13.16 13.41 14.56 14.67 15.28 |
10.23 10.67 11.42 11.86 12.34 12.70 13.45 14.68 14.80 |
10.00 10.24 11.45 12.67 13.23 13.56 14.56 14.89 15.0 |
9.95 10.23 10.43 11.43 11.35 12.60 13.10 14.34 14.79 |
10.34 10.89 11.34 11.79 12.68 13.89 13.90 14.68 14.96 |
10.50 11.65 11.98 12.45 13.56 13.78 14.20 14.80 15.00 |
2.20 2.32 2.41 2.50 2.57 2.65 2.98 3.14 3.20 |
2.56 2.68 3.00 3.27 3.41 3.69 3.71 2.88 2.99 |
2.21 2.90 3.11 3.86 2.65 3.76 3.82 3.99 3.90 |
2.21 3.22 3.45 3.56 3.67 3.80 3.99 4.0 4.21 |
2.76 2.89 2.99 3.23 3.45 3.67 3.67 3.78 3.89 |
2.17 2.20 2.34 2.43 2.65 2.70 3.00 3.23 3.65 |
||
|
L.S.D. |
S = 1.213T = 1.657S&T = 0.145 |
S = 1.546T = 1.342S&T = 0.145 |
||||||||||||
|
Total sugar |
||||||||||||||
|
0 1 2 3 4 5 6 7 8 |
53.00 53.45 54.76 54.94 55.36 55.79 56.00 57.78 58.45 |
54.65 54.76 55.32 56.00 56.27 56.53 56.80 56.93 57.00 |
52.78 53.00 53.65 54.20 54.70 55.17 55.78 56.00 56.88 |
53.50 53.65 54.00 54.43 55.11 55.34 56.00 56.89 57.23 |
52.45 53.97 54.00 55.17 55.82 56.00 56.32 56.45 56.79 |
54.78 55.90 56.45 57.00 57.89 58.23 59.17 59.83 60.11 |
21.68 21.78 22.92 22.80 23.54 23.90 24.23 24.65 24.90 |
21.50 21.86 22.34 22.87 23.56 23.89 24.00 24.67 24.95 |
22.00 22.34 22.95 23.45 23.68 24.11 24.45 24.67 24.78 |
22.34 22.68 23.45 23.56 24.58 25.23 25.57 25.89 25.94 |
21.34 22.00 22.34 22.89 23.45 23.89 24.35 34.90 25.65 |
22.34 22.67 23.00 23.78 24.45 24.89 25.45 25.90 25.95 |
||
|
L.S.D. |
S = 1.435T = 1.678 S&T = 0.153 |
S = 1.784T = 1.654 S&T = 0.143 |
||||||||||||
|
|
Reducing sugar |
|||||||||||||
|
0 1 2 3 4 5 6 7 8 |
47.90 46.65 44.70 44.12 43.45 43.11 42.45 42.11 41.45 |
46.56 46.00 45.23 44.56 43.56 42.56 42.11 41.67 40.56 |
46.56 45.34 44.67 43.66 42.68 41.68 41.25 40.89 40.21 |
46.65 56.1 45.68 44.78 43.89 42.60 41.89 40.90 40.65 |
47.45 46.25 45.68 44.30 43.78 43.11 42.58 42.11 41.56 |
46.68 45.68 44.34 43.89 43.00 42.56 42.11 41.56 41.12 |
30.60 29.68 29.00 28.58 27.11 26.68 26.86 25.45 24.60 |
29.56 28.56 27.89 27.12 26.56 25.87 25.00 24.32 24.00 |
30.12 29.56 28.45 27.23 26.78 25.56 25.11 24.68 24.08 |
29.57 28.48 27.89 26.45 25.87 25.00 24.68 24.20 23.00 |
30.56 29.65 28.45 27.54 26.78 26.00 25.58 24.84 23.56 |
29.56 28.34 27.45 26.87 26.00 25.56 24.76 24.00 23.65 |
||
|
L.S.D. |
S = 1.546 T = 1.654 S&T = 0.114 |
S = 1.546 T = 1.654 S&T = 0.114 |
||||||||||||
Total phenolic content
Data in Table (8) shows the effect of using edible coating with nanomaterials on total phenolic compounds content of Medjool and Barhy during refrigerated storage. The results indicated that total phenolic compounds content was increased with increasing the refrigerated storage period at cooled temperatures in both samples kept in packaged plastic trays and with carton boxes for both Medjool and Barhy of different treatments (a, b, c, d, e, and f) of edible films nanomaterials. The amount of total phenolic varied widely in plant materials and ranged from 1.12 to 2.20 mg/g. The decrease of total phenolic and flavonoids contents are most likely caused by the increase in sulfur compounds and terpenoids present in the nanomaterials.
Table 8. The effect of edible coating on total phenol content in Medjool and Barhy
|
Storage period (week) |
Medjool |
Barhy |
||||||||||
|
A |
B |
C |
D |
E |
F |
A |
B |
C |
D |
E |
F |
|
|
0 |
2.82 |
2.94 |
2.56 |
2.45 |
2.90 |
2.56 |
2.20 |
2.31 |
2.23 |
2.45 |
2.34 |
2.23 |
|
1 |
2.61 |
2.75 |
2.34 |
2.40 |
2.86 |
2.34 |
2.13 |
2.17 |
2.21 |
2.23 |
2.43 |
2.12 |
|
2 |
2.50 |
2.56 |
2.12 |
2.34 |
2.70 |
2.22 |
2.00 |
2.14 |
2.00 |
2.12 |
2.23 |
2.00 |
|
3 |
2.46 |
2.34 |
2.08 |
2.25 |
2.45 |
2.08 |
1.89 |
2.11 |
1.89 |
2.00 |
2.21 |
1.96 |
|
4 |
2.34 |
2.21 |
1.80 |
2.15 |
2.34 |
1.80 |
1.67 |
2.00 |
1.67 |
1.87 |
2.15 |
1.67 |
|
5 |
2.22 |
2.11 |
1.77 |
2.00 |
2.22 |
1.65 |
1.45 |
1.90 |
1.45 |
1.76 |
2.12 |
1.45 |
|
6 |
2.15 |
1.90 |
1.56 |
1.90 |
2.10 |
1.34 |
1.32 |
1.68 |
1.36 |
1.56 |
1.95 |
1.34 |
|
7 |
2.08 |
1.68 |
1.45 |
1.85 |
2.00 |
1.20 |
1.23 |
1.46 |
1.23 |
1.43 |
1.67 |
1.23 |
|
8 |
1.83 |
1.65 |
1.31 |
1.57 |
1.98 |
1.14 |
1.12 |
1.34 |
1.20 |
1.23 |
1.45 |
1.12 |
|
L.S.D. |
S = 1.456 |
T = 1.244 |
S&T = 0.156 |
S = 1.874 |
T = 1.675 |
S&T = 0.284 |
||||||
Identification and quantification of phenolic compounds and flavonoids in Medjool and Barhy
Date palm contains different phytochemicals that have various protective and therapeutic effects. Table (9) shows the phenolic compounds extracted from Medjool and Barhy of different treatments (a, b, c, d, e, and f) of edible film nanomaterials. The results show that 19 phenolic compounds were identified; while, the flavonoid extract was submitted to be analyzed by HPLC Agilent (series 1100 equipped with auto sampling injector, solvent degasser, ultraviolet detector phenols) according to the method described by Bimakr et al. (2011) [42].
Table 9. The effect of edible coating on phenol compounds and flavonoids in Medjool and Barhy products
|
|
phenol compounds |
|||||||||||
|
Medjool |
Barhy |
|||||||||||
|
A |
B |
C |
D |
E |
F |
A |
B |
C |
D |
E |
F |
|
|
Gallic Caffeine P-Coumaric Catechol Caffic Vanillic A Catechein Protocatchoic Ferulic P-OH benzoic Cinammic Chlorogenic Iso ferulic Benzoic 4. amino benzoic alpha Coumaric Salycilic Ellagic |
1.832 3.321 0.165 2.453 4.673 2.876 1.879 2.784 3.412 4.453 3.723 2.316 1.983 3.244 2.765 4.326 3.234 2.870 2.143 |
1.654 2.980 0.214 2.546 4.543 2.761 1.902 2.654 3.347 3.980 2.902 2.126 1.543 3.213 2.654 4.231 3.675 2.543 2.543 |
1.326 2.345 0.342 2.436 3.890 2.231 1.945 3.012 3.564 2.678 2.456 1.897 2.453 3.213 3.213 2.567 3.123 2.546 3.012 |
1.320 2.124 0.453 2.098 3.221 2.102 1.675 2.324 3.129 2.453 2.456 1.902 1.897 2.342 2.678 3.221 2.956 2.321 2.657 |
1.256 2.210 0.234 2.432 2.576 1.980 2.453 2.934 3.456 2.098 2.435 1.675 2.546 2.879 3.980 2.234 2.546 2.342 2.127 |
1.301 2.450 0.435 2.120 2.214 1.230 2.231 2.456 2.210 2.301 2.231 1.345 2.654 2.021 2.456 2.123 2.134 2.561 2.321 |
2.231 2.345 1.235 2.349 3.213 2.341 2.120 2.139 3.561 2.982 3.560 2.546 3.103 3.561 3.801 4.731 3.235 3.546 3.451 |
3.578 2.543 2.461 2.980 3.682 2.451 2.602 2.345 3.456 3.567 4.561 2.452 2.362 3.570 3.256 3.980 2.316 3.579 2.341 |
2.391 3.431 1.239 2.452 3.451 2.437 2.391 2.472 4.213 3.544 3.546 2.462 2.768 2.395 2.128 3.567 2.342 2.342 2.768 |
2.456 3.453 2.591 2.321 3.765 2.890 2.435 2.435 3.435 2.456 3.456 2.309 2.780 2.456 2.901 3.243 2.350 2.456 2.321 |
3.214 3.546 2.365 2.098 2.345 3.456 2.980 2.341 3.567 2.675 3.213 2.349 2.341 2.678 2.432 3.567 2.345 2.312 2.567 |
2.341 3.456 2.342 1.345 2.564 3.215 3.453 2.120 3.546 4.324 3.251 3.562 2.789 3.546 2.342 3.567 3.234 2.194 3.214 |
|
|
flavonoids |
|||||||||||
|
Rutin Naringin Apigenin Narengenin Hesperetin Kaempferol Quercetin Qurectrin B Luteolin 7 glucose C D Apigenin-7-0-neh E
|
1.543 3.231 0.768 1.870 0.986 1.3451 3.546 2.673 3.657 3.234 5.765 7.430 3.451 2.456 |
1.210 2.341 0.435 1.450 1.945 0.946 1.345 3.908 2.439 3.452 3.569 4.562 2.567 12.345
|
2.345 4.321 0.457 1.945 1.598 2.345 1.456 2.345 2.490 3.453 2.453 2.345 5.675 3.234
|
3.213 2.456 0.346 1.785 2.435 1.678 2.456 2.908 2.342 2.590 2.134 2.456 3.245 2.567 |
4.345 2.345 2.567 2.467 3.567 2.321 5.665 2.345 2.678 6.342 2.567 3.765 4.321 3.456 |
2.435 3.567 3.456 3.460 3.453 2.567 5.432 3.235 4.323 3.453 3.234 4.564 3.546 3.561
|
3.456 3.765 3.467 5.432 4.672 2.342 5.543 5.654 3.236 4.395 5.325 4.356 6.543 3.432 |
4.345 5.324 2.567 3.154 4.657 4.567 3.543 4.321 5.678 3.234 4.543 3.213 5.436 4.324
|
3.456 2.345 5.432 4.324 4.564 3.453 2.342 4.678 3.234 3.456 5.789 4.564 3.453 2.342 |
2.324 3.456 2.654 3.546 2.345 5.432 3.456 4.654 3.456 4.567 4.342 3.456 3.546 2.345 |
2.435 3.546 2.345 4.564 4.321 3.567 3.234 4.546 3.567 3.576 3.234 2.345 2.546 3.654 |
2.435 2.456 4.567 3.567 3.456 5.675 4.654 5.654 3.345 4.654 3.456 3.546 4.657 3.453 |
A=3.4.5.methoxy cinnamic B=Acacetin neo.rutinoside C= Apigenin 6-rhamose 8-glucose D=Apigenin 6-arabinose 8-glactose E=Kaempferol3-2-p-coumaroylglucose
Color change
The color was measured recording lightness (L * value), chroma (intensity of color) and hue angle (hº)(Table 10). There was a significant decrease in L * value with increase storage for all treatments, date palm Medjool and Barhy with (a, b, c, d, e, and f) had darker color (low L * value). The coated samples showed a significant decrease in hue angle and chroma during storage period until 8 weeks of storage, and fruits coated with (C, D, E) in Barhy developed a redder and less hue angle values compared to other samples. On the other hand, the treatments coated with (A, B, C) in Medjool gave fruits with higher chroma and hue angle (less yellow in Barhy and brown in Medjool). These results were in agreements with those obtained by Colla et al. (2006) [43]. As observed, the edible film preservation on date palm Medjool and Barhy products had changes in color and hue-angle (ho) value [44].
Table 10. The effect of edible coating on color in Medjool and Barhy products
|
Storage period (week) |
Medjool |
Barhy |
||||||||||
|
A |
B |
C |
D |
E |
F |
A |
B |
C |
D |
E |
F |
|
|
0 |
57.0 |
56.7 |
56.5 |
54.2 |
55.4 |
56.5 |
52.3 |
50.8 |
49.6 |
52.4 |
53.5 |
52.6 |
|
1 |
56.4 |
55.6 |
54.5 |
54.0 |
54.3 |
55.3 |
51.4 |
50.1 |
48.3 |
51.3 |
52.1 |
51.3 |
|
2 |
56.3 |
54.7 |
53.6 |
53.5 |
53.5 |
54.3 |
50.2 |
49.5 |
47.4 |
50.0 |
51.2 |
50.5 |
|
3 |
55.3 |
54.0 |
54.2 |
52.6 |
52.9 |
53.5 |
49.6 |
48.7 |
46.3 |
49.6 |
50.5 |
49.5 |
|
4 |
54.5 |
43.4 |
53.2 |
51.6 |
51.5 |
52.6 |
48.8 |
47.5 |
45.2 |
48.6 |
49.6 |
48.4 |
|
5 |
53.6 |
53.1 |
52.1 |
50.5 |
50.5 |
51.9 |
47.5 |
46.8 |
44.6 |
47.6 |
46.5 |
47.3 |
|
6 |
53.4 |
52.7 |
51.5 |
50.0 |
50.0 |
51.6 |
46.5 |
46.0 |
43.7 |
47.2 |
45.6 |
46.4 |
|
7 |
53.6 |
52.7 |
51.2 |
49.4 |
49.6 |
50.5 |
44.3 |
45.6 |
42.3 |
46.7 |
44.5 |
45.2 |
|
8 |
52.8 |
51.9 |
51.0 |
48.6 |
49.0 |
50.0 |
43.1 |
44.6 |
42.0 |
45.5 |
43.8 |
45.0 |
|
L.S.D. |
S = 1.732 |
T = 1.345 |
S&T = 0.126 |
S = 1.435 |
T = 1.657 |
S&T = 0.125 |
||||||
Microbial evaluation of Medjool and Barhy products
Data in Table (11) shows the changes in total bacterial counts, psychrophilic bacteria and mold and yeast counts of Medjool and Barhy coated during storage periods. The data indicates that total counts, psychrophilic bacteria and mold and yeast counts gradually increased with an increase in the cold storage period in both Medjool and Barhy products of different treatments. The bacterial counts reached to 18.54 and 17.87 x 10⁻¹ CFU / g for D and F respectively of Medjool; while, bacterial counts of Barhy coated recorded 18.94 and 18.43 x 10⁻¹ CFU / g with D and F, respectively after 8 weeks of cold storage as compared to the initial counts (2.00 to 300 x 10-1CFU / g). Mold and yeast counts of Medjool coated treatment D and F reached to 10.60 and 11.45 x 10⁻¹ CFU / g respectively; whereas, Barhy coated treatments D and F reached to 11.45 and 11.23 x 10⁻¹CFU/g, respectively. On the other hand, psychrophilic bacterial of Medjool and Barhy coated treatments D and F reached 8.78 and 8.95 and 10.17 and 9.98 x 10⁻¹CFU/g, respectively during storage period as compared to the initial counts 0.23 to 0.78 x 10⁻¹CFU/g. According to Chandrasekaran and Bahkali (2013) Shenasi et al. (2002) [45, 46], the microbiological quality of the processed dates by-products could be explained by microbial profiles of date paste, date syrup, date jam, date flesh powder, and date seed powder samples.
Table 11. The changes in the total bacterial counts
|
Storage period (week)
|
T.C |
|||||||||||
|
Medjool |
Barhy |
|||||||||||
|
A |
B |
C |
D |
E |
F |
A |
B |
C |
D |
E |
F |
|
|
0 1 2 3 4 5 6 7 8 |
2.32 2.93 3.34 5.43 7.56 9.43 12.45 15.67 17.45 |
2.00 3.21 4.34 6.32 8.54 10.43 13.45 16.23 17.54 |
2.62 3.65 4.76 6.87 9.65 10.65 12.43 14.76 16.54 |
2.80 4.32 6.43 8.45 11.34 13.54 15.67 16.23 18.54 |
3.00 4.56 6.76 8.89 10.76 12.65 13.78 14.43 15.43 |
2.43 4.34 5.65 6.76 8.54 10.56 12.45 14.65 17.87 |
2.80 4.56 6.65 8.65 10.98 10.54 12.56 15.65 17.45 |
3.12 5.54 6.65 8.67 11.43 14.32 15.32 16.76 17.34 |
3.23 4.76 6.87 8.67 10.45 12.45 14.54 16.34 17.65 |
3.21 3.76 6.87 9.65 11.43 14.34 16.32 18.67 18.94 |
2.32 3.89 6.34 8.56 10.45 12.43 14.67 16.67 17.56 |
2.45 3.45 4.65 6.87 8.89 10.76 12.54 14.76 18.43 |
|
L.S.D. |
S = 2.345 T = 2.236 S&T = 0.457 |
S = 2.689 T = 2.453 S&T = 0.341 |
||||||||||
|
PSY |
||||||||||||
|
0 1 2 3 4 5 6 7 8 |
0.50 1.32 2.44 3.43 5.31 6.54 7.87 8.25 8.46 |
0.45 1.00 1.63 1.90 2.23 4.25 6.76 7.56 7.89 |
0.34 1.02 1.67 2.43 3.65 4.65 5.65 7.45 7.34 |
0.40 1.34 1.89 2.21 3.56 4.23 5.65 7.27 8.78 |
0.46 1.30 2.00 2.56 3.68 4.87 6.23 6.87 7.94 |
0.43 1.54 2.43 4.65 5.87 6.87 7.87 7.98 8.95 |
0.23 1.43 2.32 3.54 4.67 5.54 6.56 7.54 8.34 |
0.56 1.65 2.56 3.65 5.76 6.76 7.76 7.96 8.67 |
0.56 1.35 2.43 3.67 4.76 5.67 7.87 7.90 8.67 |
0.78 1.45 2.65 3.65 4.67 5.76 6.87 7.89 10.17 |
0.56 2.43 3.68 4.56 6.45 7.87 8.89 9.78 9.86 |
0.32 1.76 2.45 3.65 4.76 5.78 6.87 7.98 9.98 |
|
L.S.D. |
S = 1.341 T = 1.546 S&T = 0.124 |
S = 1.653 T = 1.489 S&T = 0.234 |
||||||||||
|
M&Y |
||||||||||||
|
0 1 2 3 4 5 6 7 8 |
1.20 1.96 2.42 3.54 4.54 5.65 6.76 7.87 8.89 |
1.43 2.23 3.45 4.54 5.67 6.76 7.78 8.98 9.54 |
1.45 2.34 3.76 4.89 5.67 6.87 7.98 8.90 9.56 |
1.36 2.54 4.56 5.34 6.76 7.78 8.87 9.90 10.60 |
1.56 2.67 5.89 6.76 7.87 8.45 9.78 10.12 10.53 |
1.32 2.54 4.54 6.76 7.89 8.90 9.45 10.67 11.45 |
1.68 2.45 3.76 4.89 6.54 8.56 9.78 10.56 11.54 |
1.32 2.43 3.67 4.76 5.78 6.34 7.89 8.90 10.32 |
1.34 2.45 4.65 5.76 6.87 7.89 8.67 8.98 10.43 |
1.85 2.45 4.65 5.45 6.78 7.89 8.56 9.78 11.45 |
1.54 2.54 3.46 4.76 5.87 6.87 7.98 8.98 11.43 |
1.45 2.54 3.54 4.65 5.76 6.87 7.67 8.90 11.23 |
|
L.S.D. |
S = 1.756 T = 1.987 S&T = 0.234 |
S = 1.437 T = 1.589 S&T = 0.126 |
||||||||||
CONCLUSION
It could be noticed that edible films incorporated with nanomaterials can improve quality attributes of Medjool and Barhy products since they protect the physical, chemical and microbiological quality attributes of Medjool and Barhy products during cold storage. Maintained weight loss, soluble solids content, color, acidity, total sugars and reducing sugars, total carbohydrate, phenol compound, flavonoids, total phenols contents, total count, psychrophilic bacteria counts and mold and yeast quality attributes during storage at (0 °C) and relative humidity of 70-75% of fruits Medjool and Barhy were studied during the storage. Other physical and chemical properties were studied including rheological properties, particle size distribution emulsion, zeta potential emulsion, and scanning electron microscopy films. The effect of adding nanomaterials on edible films are to prolong the product shelf life, reduce the risk of microorganisms growth and improved quality on fruit and vegetables surfaces. The results of the analysis of edible films nanomaterials indicated that the best nano-coating treatment is (B) followed by the samples (C, E, A, D, and F) Medjool and Barhy fruits dipped in solution of (B) with reduced weight loss percentage and maintained fruit quality for 60 days of storage.
ACKNOWLEDGEMENTS
The project was funded by the Deanship of Scientific Research (DSR), University of Tabuk, Kingdom of Saudi Arabia (KSA) under grant No. (S-0170- 1438). The authors, therefore, acknowledge DSR technical and financial support.
REFERENCES
- Mahmud, I.A., Mirghani, M.E.S., Alkhatib. Nutrients depictions of Barhi date palm (Phoenix dactylifera L.) kernels. International Food Research Journal 2017 ; 24 (Suppl): S325-S334.
- Kotadiya, R. M., Savant, N. P., Upadhyay, U. M. Colon Targeted Moringa Gum Compression Coated Tablets of Capecitabin: A Factorial Approach. Pharmacophore, 2019 ; 10(1).
- Mirhosseini H, Amid BT. A review study on chemical composition and molecular structure of newly plant gum exudates and seed gums. Food Res Int. 2017; 46: 387-398.
- Mane, G. G., Hamde, V. S. Isolation and identification of Exopolysaccharide producing Cronobacter species from root nodules of leguminous plants. Journal of Biochemical Technology, 2018 ; 9(2), 1.
- Albeladi, O. A. Histochemical Study of the Effect of Glycerol on the Kidney of Male Albino Rats Treated with Gum Arabic. Journal of Biochemical Technology, 2019 ; 10(1), 91-97.
- Anuradha Sahaa, Shvetambri Tyagib, Rajinder K. Natural gums of plant origin as edible coatings for food industry applications.Critical reviews in biotechnology, 2017 ; 37(8), 959--973.
- Kohajdová, Z., Karovičová, J. Influence of hydrocolloids on quality of baked goods. Acta Scientiarum Polonorum Technologia Alimentaria, 2008 ; 7(2), 43-49.
- Rojas-Graü, M. A., Tapia, M. S., Martín-Belloso, O. Using polysaccharide-based edible coatings to maintain quality of fresh-cut Fuji apples. LWT-Food Science and Technology, 2008 ; 41(1), 139-147.
- Tapia, M.S., Rojas-Grau, M., Carmona, A. Use of alginate- and gellan-based coatings for improving barrier, texture and nutritional properties of fresh-cut papaya. Food Hydrocolloids, 2008 ; 22: 1493-1503.
- Jafarizadeh M , H., Osman, A., C.P., Abdul Rahman, R. Evaluation of effectiveness of three cellulose derivative-based edible coatings on changes of physico-chemical characteristics of ‘Berangan’ banana (Musa sapientum cv. Berangan) during storage at ambient conditions. International Food Research Journal 2011 ; 18 (4): 1381-1386.
- Suisui Jiang, Chenzhen Liu, Zhongjie Han. Evaluation of rheological behavior of starch nanocrystals by acid hydrolysis and starch nanoparticles by self-assembly: a comparative study. Food Hydrocolloids 2016 ; 52, 914-922.
- Mehdi J. J., Ashkan M., Mohamad saeed Y. An attempt to cast light into starch nanocrystals preparation and cross-linking .Food Chemistry, 2013 ; 141, 1661-1666.
- María L. Zambrano-Zaragoza, Ricardo González-Reza. Nanosystems in Edible Coatings: A Novel Strategy for Food Preservation. Int. J. Mol. Sci. 2018 ; 19, 705; doi: 10.3390 / ijms19030705
- Maftoonazad N, Ramaswamy H.S, Moalemiyan, M, Kushalappa. Effect of pectin-based edible emulsion coating on changes in quality of avocado exposed to Lasiodiplodia theobromae infection. Carbohydrate Polymers, 2007 ; 68, 341--349.
- Ruelas-Chacon, J. Contreras-Esquivel, J. Water vapor permeability, mechanical, optical, and sensorial properties of plasticized guar gum edible films,” in Research Methodology in Food Science Integrated Theory and Practice, C.O. Mohan, E. Carvajal-Millan, and C. N. Ravishankar, Eds., Apple Academic Press, CRC Press, Taylor & Francis Group, (Talboys, Thorofare, NewJersey, USA), 2017.
- Magdy M. H. Senna, Khalid M. Al-Shamrani, Abdullah S. Edible Coating for Shelf-Life Extension of Fresh Banana Fruit Based on Gamma Irradiated Plasticized Poly (vinyl alcohol) / Carboxymethyl Cellulose / Tannin Composites. Materials Sciences and Applications, 2014 ; 5, 395-415.
- Garcia, M. A., Martino, M. N., Zaritzky, N. E. Lipid addition to improve barrier properties of edible starch‐based films and coatings. Journal of food science, 2000; 65(6), 941-944.
- AOAC. Association of Official Analytical Chemists. Official Methods of Analysis, 19th ed. Washington, D.C, 2010.
- Dubois, M.; Gilles, K.A.; Hamilton, J.K.; Rebers. Colorimetric method for determination of sugars and related substances. Anal. Chem., 1956 ; 26, 350-356.
- Kahkonen, M.P.; A.I. Hopia; H.I. Vuorela; Rauha J.P. Antioxidant activity of plant poly phenolic compounds. J. Agric Food Chem., 1999 ; 47: 3954-3962.
- Ivanova, V.; M. Stefova, F. Chinnici. Determination of the polyphenol contents in Macedonian grapes and wines by standardized spectrophotometric methods. J. Serb. Chem. Soc., 2010 ; 75 (1): 45-59.
- Goupy, P., M. Hugues, P. Boivin, M. Amiot. Antioxidant composition and activity of barley (Hordeum vulgare) and malt extracts and of isolated phenolic compounds. J. Sci. Food and Agric., 1999 ; 79: 1625-1634
- Barbagallo, R. N.; M. Chisari, G. Caputa. Effects of calcium citrate and ascorbate as inhibitors of nailing and softening in eggplant 'berga' minimum processed. Postharvest Biology and Technology. 2012 ; 73: 107-114.
- Marshall, S. Standard methods for examination of dairy products American Public Health Association (ABHA). Washington DC, USA, 1992.
- A.P.H.A. American Public Health Association.Compendium of methods the microbiological examination Foods, Washington.U.S.A, 1976.
- Snedecor, G. W., Cochran, W. G. Statistical methods., 8th edn.(Iowa State University Press: Ames, IA). lowa – USA, 1989 : 50.
- Ottone, M. L., Deiber, J. A. Modeling the rheology of gelatin gels for finite deformations part2. Viscoelastic solid Model Polymer, 2005 ; 4938-4949. 532.
- Walkenström, P., Nielsen, M., Windhab, E., Hermansson, A. M. Effects of flow behaviour on the aggregation of whey protein suspensions, pure or mixed with xanthan. Journal of Food Engineering, 1999 ; 42(1), 15-26.
- Danijela Z. Šuput, Vera L. Lazić, Lato L. The effects of glycerol and guar-xanthan mixture on mechanical and barrier properties of starch-based edible films - Chemometric analysis.Hem. Ind. 2016 ; 70 (6) 739-744.
- Franciele Maria Pelissari, Margarita María Andrade-Mahecha. Comparative study on the properties of flour and starch films of plantain bananas (Musa paradisiaca).Food Hydrocolloids, 2013 ; 30, 681-690.
- Jie X., Yunqi L., Qingrong H. Recent advances on food-grade particles stabilized pickering emulsion: Fabrication, characterization and research trends. Trends in Food Science & Technology, 2016 ; 55, 48-60.
- Teng, Z., Luo, Y., Wang, T., Zhang, B., Wang, Q. Development and application of nanoparticles synthesized with folic acid conjugated soy protein. Journal of agricultural and food chemistry, 2013 ; 61(10), 2556-2564.
- ASTM. Potential Zeta from Colloids in Water and Wastewater, at ASTM Standard D, American Society for Testing and Materials, 1985 : 4187-4182.
- Teng, Zi, Ruoyang Xu, Qin Wang, Betalactoglobulin-based encapsulating systems as emerging bioavailability enhancers for nutraceuticals: a review, RSC Advances, 2015.
- Sailaja.A. Amareshwar. P. Preparation of SA nanoparticles, by dissolvent technique using acetone as dissolving agent. International journal of pharmaceutical sciences & nanotechnology. 2012 ; 5(1), 1647-1643.
- Bellaouchi, R., Ghomari, I., Hasnaoui, A., Hakkou, A. Physical, chemical and microbial properties of undervalued dates and date derivatives manufactured in Morocco. International Food Research Journal, 2017 ; 24 (3): 963-969.
- Abd El-Zaher, M.H. Studies on fruit without seeds of date palm. Barhi: the effect of spraying with some natural materials on pollinated fruits, unpolluted fruits and fruit properties Set.Journal of Applied Sciences Research, 2008 ; 4 (7): 906-916.
- OMAIMA, O. M. H., Maksoud, M. A., NAGWA, S. Z., MALAKA, A. S. Use Pre-Harvest Treatments To Keeping Quality And and Long Shelf Life Of of Some Date Palm Cultivars. Selcuk Journal of Agriculture and Food Sciences, 2011 ; 25(1), 65-74.
- Esam, A. M., Ashour, N. E., Omaima, M. H., Malaka, A. S. Effects of application commercial product rates and times on yield and fruit quality of cv. Medjool date palms. Inter. J. of Chem. Tech. Rese, 2016 ; 9(4), 43-50.
- Omaima, M. H., Malaka, A. S., MM, N. Quality improvement and storability of some date palm cultivars by safe postharvest treatments. Australian Journal of Basic and Applied Sciences, 2012 ; 6(3), 542-550.
- Hosny, S. S. Comparative study of some semi-dry Arabian date palm cultivars grown in Mounofia governorate. Egypt. J. Agric. Res, 2016 ; 94(4), 859-873.
- Bimakr, M.; Abdul Rahmana, R.; Farah, S. T. Comparison of different extraction methods for the extraction of major bioactive flavonoid compounds from spearmint (Menthaspicata L.) leaves. Food and bioproducts processing, 2011; 89: 67-72.
- Colla, E., do Amaral Sobral, P. J., Menegalli, F. C. Amaranthus cruentus flour edible films: influence of stearic acid addition, plasticizer concentration, and emulsion stirring speed on water vapor permeability and mechanical properties. Journal of agricultural and Food Chemistry, 2006; 54(18), 6645-6653.
- Shiekh, R. A., Malik, M. A., Al-Thabaiti, S. A., Shiekh, M. A. Chitosan as a novel edible coating for fresh fruits. Food Science and Technology Research, 2013 ; 19(2), 139-155.
- Shenasi, M., Aidoo, K. E., Candlish, A. A. Microflora of date fruits and production of aflatoxins at various stages of maturation. International Journal of Food Microbiology, 2002 ; 79(1-2), 113-119.
- Chandrasekaran, M., Bahkali, A. H. Valorization of date palm (Phoenix dactylifera) fruit processing by-products and wastes using bioprocess technology – Review. Saudi Journal of Biological Sciences, 2013; 20 (2): 105-120.
